The objective here is to have the basic graphs of all six trigonometric functions ready to go. Here is a link to a one-page
printable reference sheet.
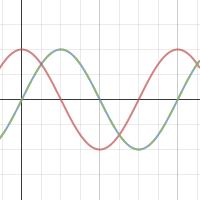
1. One period graphed for the
sine function. (
y = sin
x )
2. One period graphed for the
cosine function. (
y = cos
x )
Notice that cosine function is a horizontal translation of sine by π/2 units. To see this click on the link below for an interactive graph.
3. One period graphed for the
cosecant function. (
y = csc
x = 1 / sin
x )
4. One period graphed for the
secant function. (
y = sec
x = 1 / cos
x )
Notice that the zeros of sine and cosine define vertical asymptotes for the cosecant and secant functions. To see this click on the link below for an interactive graph.
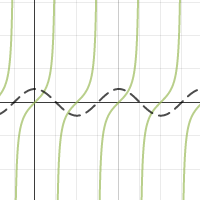
5. One period graphed for the
tangent function. (
y = tan
x = sin
x / cos
x )
6. One period graphed for the
cotangent function. (
y = cot
x = cos
x / sin
x )
Notice that for the tangent function, the zeros of cosine determine the vertical asymptotes. And for the cotangent function, the zeros of sine determine the vertical asymptotes.
Enjoy.